

 I think this describes the mindset of many market participants, suspicious of how far we’ve come since the crash of 2008. The ghost of that era still haunts investors; so much so, many cut their equity holdings dramatically or totally avoided stocks (sideline money=buying power). The recent mini-correction has reinforced this skepticism and the media has seized upon this to continue to foment fear and trepidation. It keeps eyes on the paper, the web sites and, of course, the tube…corrections being a gift that jars investors from the easy complacency of a gradually up-trending market.
Recently, I spotted a couple of particularly egregious reports, specifically designed to draw investors closer to the panic button. Pieces, that if you did not know the background or track record of the presenter, could be very disconcerting. One of these features the always convivial, always ranting, always negative and never right, CNBC ‘Bond Maven’, Rick Santelli.
The Chartist
Even though Santelli is supposed to be the ‘Bond Maven’, his commentaries and guests range far afield (including heavy political overtones). On January 27, Rick’s guest was technician, Tom DeMark. Chartist DeMark is well-known and a consultant to many high-powered institutional investors and he has had some good calls in his long career. Having said this, his methods are extremely complex and require many things to fall into place before he makes a call (not always correct). The reason Santelli had him on was that DeMark recently published a negative piece comparing the chart formation of 1929 to that of 2013. You see where Santelli is going with this. The market is down 5% or 6% after a great run and, all of a sudden, we are looking down the barrel at a 40% correction. This is scary stuff. Get ready to hit the exits! Then again, maybe it is just ‘fair and balanced’. But, wait a minute, Santelli is always negative. (DeMark clip)
The Old Timer
Art Cashin epitomizes the class guys who used to populate the floor of the non-automated New York Stock Exchange. Although Art has been a cautionary voice for the past few years, he usually is a moderate voice and a voice of market wisdom and experience.
It was very disappointing to me when, at the height of Monday’s (2/3/2014) sell off, Art decided to compare the recent ‘flight to safety’ demonstrated by the strong upward move in the 10-year U.S. Treasury Note to the moves we saw in 2008/2009. That he made this analogy was bothersome, and that he did while the market was under severe selling pressure was even more disconcerting. Methinks he’s been hanging with the CNBC crowd too long.
Art’s concern was that rates were supposed to go up after the Fed began its taper of Quantitative Easing. Instead, they were going down. Ergo, something really bad was happening under the surface. What Art seems to have forgotten or may not know, is that QE, even at its height, was just a small part of the daily trading in long-dated treasuries; and, oh by the way, they are still buying $65 billion per month (1/2 treasuries, 1/2 AMBS). We detail this in session–52. Anyway, Art was overwrought. He cautioned if we broke 2.6% on the 10-year it might signal real problems ahead. We did break to 2.58% later that day and closed today (2/5/2014) 2.67%. It is the safety trade Art, not Armageddon!
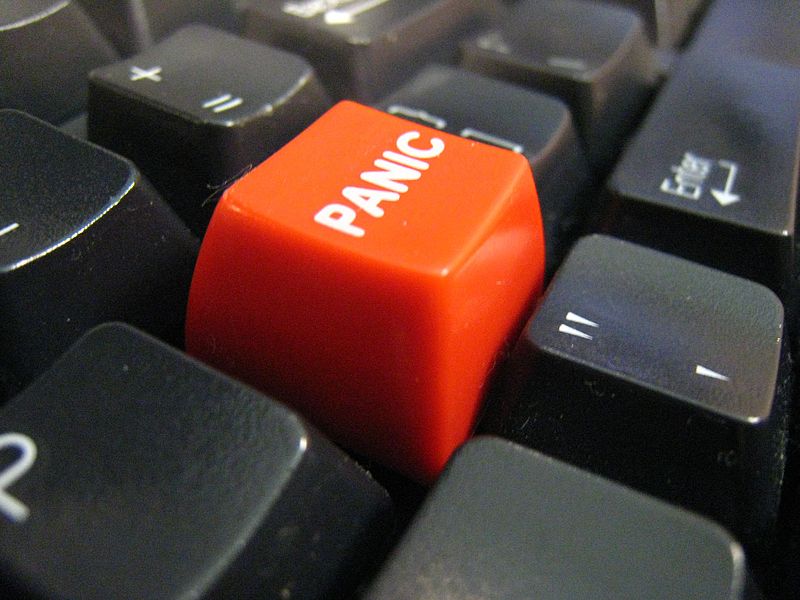
I still believe that most investors are not, nor have they been euphoric, that they have one foot out the door and one finger on the panic button. This is a constructive psychological backdrop for the market.
What do you think?
The information presented in kortsessions.com represents my own opinions and does not contain recommendations for any particular investment or securities. I may, from time to time, mention certain securities for illustrative purpose, names where I personally hold positions. These are not meant to be construed as recommendations to BUY or SELL. All investments and strategies should be undertaken only after careful consideration of suitability based on the risks, tolerance for risk and personal financial situation.